Main activities and results 2016
Work package 1 – Electrodeposition of porous 3D metallic nanofoams
Task 1.2 – Metallic nanofoams for hydrogen production Electrodeposition of Ni nanofoams

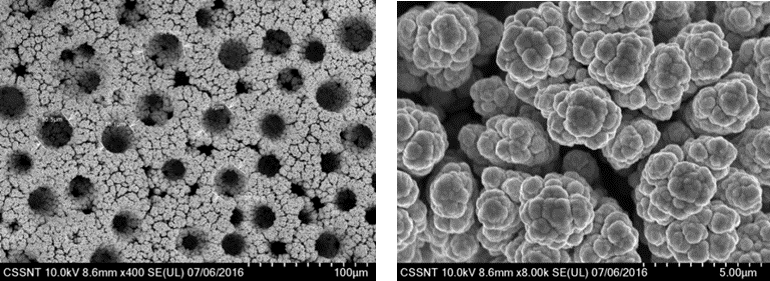
SEM micrographs for Ni nanofoams electrodeposited onto stainless steel substrate (1.54 A/dm2, 3 min.)

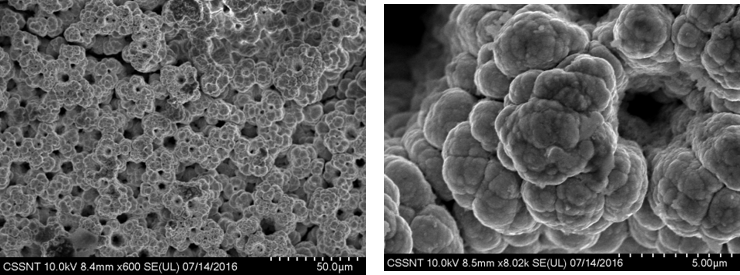
SEM micrographs for Ni nanofoams electrodeposited onto stainless steel substrate after an initial anodic etching treatment to increase the coating adhesion (2 A/dm2, 1 min.)

SEM micrograph (left) and EDX spectrum (right) for Ni-Mo (20 wt.% Mo) alloy coating electrodeposited from a citrate-ammonium electrolyte (7.8 A/dm2, 60oC)

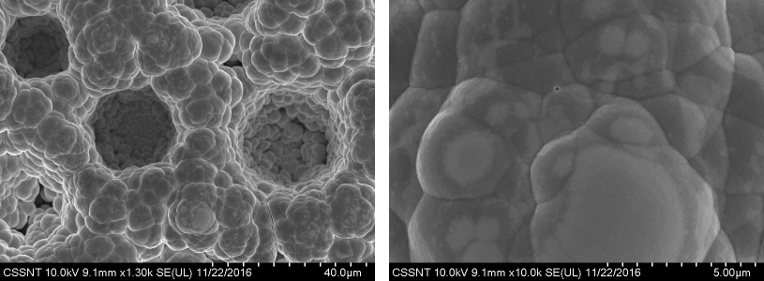
SEM micrographs for Ni-Mo(20 wt.% Mo) alloy onto Ni nanofoam (8 A/dm2, 60oC, 10 min.)

SEM micrographs for Ni-W (approx.19-25 wt.% W) alloy coatings onto Ni nanofoam at 70oC for 30 min. at different applied current densities: (A) 5.5 A/dm2; (B) 6.4 A/dm2; (C) 7.2 A/dm2

SEM micrographs for Ni-Fe (approx.19-25 wt.% Fe) alloy coatings onto Ni nanofoam (5 A/dm2, 65oC, 15 min.)

SEM micrographs for Ni-Co (approx.45-55 wt.% Co) alloy coatings onto Ni nanofoam (0.8 A/dm2, 85oC, 30 min.) using ionic liquids based on choline chloride

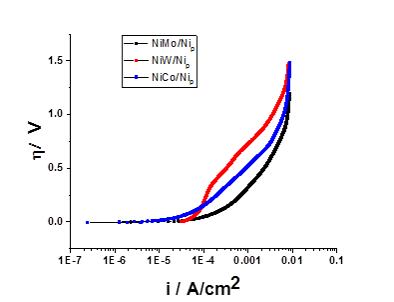
Tafel plots (h-log i) in sea water electrolyte for Ni alloys electrodeposited onto Ni nanofoams t=25oC (10 mV/s)
Tafel slopes values for HER in seawater for various electrodes types at 25oC
| Working electrode type | Tafel slope, bc (mV/dec) |
| Ni-Mo directly deposited onto 3D Ni nanofoam | 62±10 |
| Ni-W directly deposited onto 3D Ni nanofoam | 81±10 |
| Ni-Co directly deposited onto 3D Ni nanofoam | 70±10 |
| Ni-Fe metallic foil
(20 wt.%Fe) |
196±10 |
| Ni-Fe directly deposited onto 3D Ni nanofoam
(20 wt.%Fe) |
148±10 |