Electroformed Ni-Fe alloy thin metallic foils
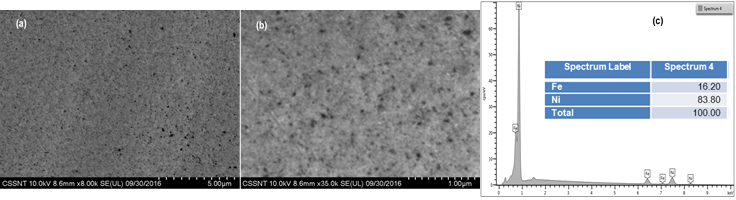
Figure 1. SEM micrographs at different magnifications (a,b) and EDX spectrum (c) of Ni-Fe alloy thin metallic foils electrodeposited at 65oC for 30 min, at 35 mA/cm2 (Ni2+/Fe2+ = 15.6)
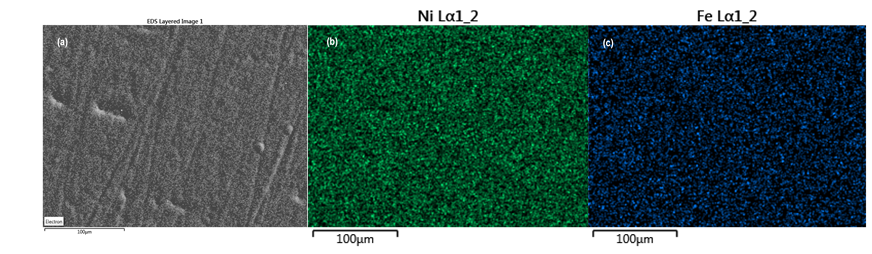
Figure 2. SEM image of Ni-Fe alloy deposit (a) and EDX maps of elemental distribution for: Ni (b); Fe (c)